
Welcome to the second part of our blog series, Navigating Trust in Research.
In this installment, we delve deeper into the world of data availability statements (DAS) using Trust Marker data from Digital Science’s Dimensions database.
We further explore the collaboration efforts at different levels supporting research endeavors that exemplify best practices by including a DAS, shedding some light on the key players driving transparency and reproducibility in academic research. More importantly, we explore DAS trends and insights around particular collaborations between countries within certain income groups and investigate the case of Ethiopia as a country with outstanding Trust Marker performance.
An examination of DAS and other Trust Marker data reveals some interesting trends in research collaboration and transparency across different income regions. Several key takeaways emerge:
- Both national and international collaborations across multiple income groups tend to have higher rates of DAS adoption compared to research output from single institutions. International and national research often necessitates more comprehensive data management plans. This appears to positively influence DAS practices.
- Lower income countries exhibit high levels of DAS adoption within nationally collaborative and independent research. This is exemplified by the impressive growth in Ethiopia’s DAS rates across publications with national, international, and single institutional affiliations. Internal policies and a strategic national focus on areas like health seem to be key drivers.
- While higher income countries demonstrate steady improvement in DAS rates over time, the growth trajectory lags behind that of low-income regions in collaborative and independent research scenarios.
Introduction
In Part I of Navigating Trust in Academic Research: The Rise of Data Availability Statements, we discussed the rapid expansion of Data Availability Statements (DAS) practices globally, with substantial growth occurring in the last three years. The growth, however, has not been shared equally among some of the countries we sampled. While countries such as China, Australia, Canada, and the UK have witnessed a significant surge in the adoption of DAS, others have experienced more modest increases or variations in their DAS practices. These disparities highlight the need for a closer examination of the factors contributing to the divergent trends in DAS practices within academic research across different regions.
As we continue our exploration, we first shift our focus from the presence of a DAS to the underlying collaborative landscape examining patterns of collaboration across income groups.
Methodology
In conducting this analysis, we again rely on Digital Science’s Dimensions database and the Dimensions Research Integrity dataset. We use the Dimensions on Google BigQuery provision to extract data on research output, underlying funder data and associated countries using the organization associated with each author. Additional country data from the Google BigQuery World Bank dataset is also integrated for further analysis. Research output for this study excludes books, chapters and monographs.
As with Part I of the blog, we limit research outputs from 2017 to 2022 to ensure focused analysis. We extracted metadata from the research outputs including Fields of Research (FoR), Sustainable Development Goals (SDGs), supporting funder, author affiliation including institution and country, and the associated Economic Development Class as defined by the World Bank dataset (publicly available in the BigQuery environment). Where we are exploring underlying funder trends, only those publications where an underlying funder has been identified are included.
Research output is associated with an income group if at least one author is affiliated with a country within that income group at the time of publication.
Findings
Figure 1 shows the growth of DAS according to the World Bank’s classification of countries by income groups. Low-income countries are leading in DAS practices, with publications containing DAS increasing from just below 20% in 2017 to approximately 55% in 2022. Both the high-income group and the upper-middle-income group exhibit similar growth patterns, with DAS adoption rates rising from very low levels in 2017 to over 30% in 2022. The lower-middle-income group lags behind, showing a widening gap in DAS practices compared to other income groups, despite its natural rate of improvement over the same period.

This overall trend may come to the surprise of some, as there is a common perception that research culture and practices tend to be more robust within higher-income groups. Addressing this question requires us to delve deeper into the factors that potentially influence the adoption of trust markers and the distinctive dynamics within each income stratum. We do so by looking into the trends and dynamics of research collaborations, the underlying funder patterns, and their potential role in shaping DAS practices.
Collaborations and DAS practices
Table 1 presents the total volume and proportion of publications containing DAS, for those that have no collaboration (outside the authors institution), national collaboration and international collaboration over the past six years (i.e., 2017-2022). Overall, 32% (or about one in every three) of the publications we examined contained DAS in 2022.
Interestingly, when we specifically looked at publications resulting from collaborations involving multiple income groups on an international scale, we observed a higher proportion containing DAS, which stood at 39% in 2022. This trend of a higher presence of DAS in such collaborative publications has been consistent in previous years.
| ALL | Total Publications | DAS Publications | Overall DAS(%) | Publications – No Collaboration (%) | Publications – No Collaboration DAS (%) | Publications – Intra Country Collaboration (%) | Publications – Intra Country Collaboration DAS (%) | Publications – International Collaboration (%) | Publications – International Collaboration DAS (%) |
| 2017 | 2325127 | 92430 | 4% | 41% | 2% | 25% | 5% | 31% | 6% |
| 2018 | 2490261 | 133225 | 5% | 40% | 3% | 25% | 7% | 32% | 7% |
| 2019 | 2675989 | 203412 | 8% | 39% | 5% | 26% | 9% | 32% | 10% |
| 2020 | 3035154 | 380341 | 13% | 38% | 9% | 26% | 15% | 33% | 15% |
| 2021 | 3274595 | 750668 | 23% | 38% | 16% | 27% | 27% | 33% | 28% |
| 2022 | 3311785 | 1064173 | 32% | 37% | 24% | 28% | 38% | 32% | 39% |
Looking at these figures on a global scale, the proportion of Data Availability Statements vary only slightly between intra-country collaborations and international collaborations.
Several factors could have potentially contributed to the observation. First, international projects usually require comprehensive research data management and sharing plans. Researchers from institutions with strong policies on data management influence the practices in collaborative work. This tends to push research collaborators towards the adoption of best practices in research, including data sharing norms such as DAS in research publications. Second, international collaborations sometimes involve the integration of data from different sources and jurisdictions. To navigate a complex landscape of funding and ethical requirements regarding data usage and sharing often necessitates clear data availability statements.
Collaborations and DAS disparities for low- and high-income groups
When the dataset is further partitioned into different income groups, we observe different levels of engagement in cross-institution research collaborations between the high- and low-income countries.
We examined approximately 1.5 million publications with at least one author from a high-income country group in 2022. Among which, one-third were the output of a single institution, and two-thirds were the output of national or international collaborations (Table 2). In comparison, publications with at least one author from the low-income country group published substantially less, but with a much higher rate of cross-institution collaboration, especially international collaboration. This likely reflects a stronger inclination for researchers in low-income countries to engage in collaborative efforts and seek international partnerships. There also tends to be a global nature of research efforts in low-income countries. This may stem from the need to address global challenges that disproportionately affect these regions, such as infectious diseases or the impact of climate change (Aksnes & Sivertsen, 2023).
| Country Income Group | No. of publications examined | No Collaboration Outside Institution (%) | National Collaboration (%) | International Collaboration (%) |
| High | 1557116 | 33% | 27% | 39% |
| Low | 27085 | 22% | 11% | 63% |
There are several potential discussion points stemming from these findings. Has the dependency on international resources and collaborations brought along an increased emphasis on open science and DAS, possibly as a condition of international funding and partnerships when it comes to research from lower-income regions? Do varying incentive structures account for differences in the rate of increase in DAS between national and international collaborations? What influence does policy and funding sources have, particularly in projects involving low-income countries? Finally, what part do local research priorities have to play within these regions? Perhaps the focus on international collaboration in low-income countries is driven by the need to address pressing local issues that have global implications, thus requiring a broader data-sharing approach. Or perhaps they are simply leading for other reasons.
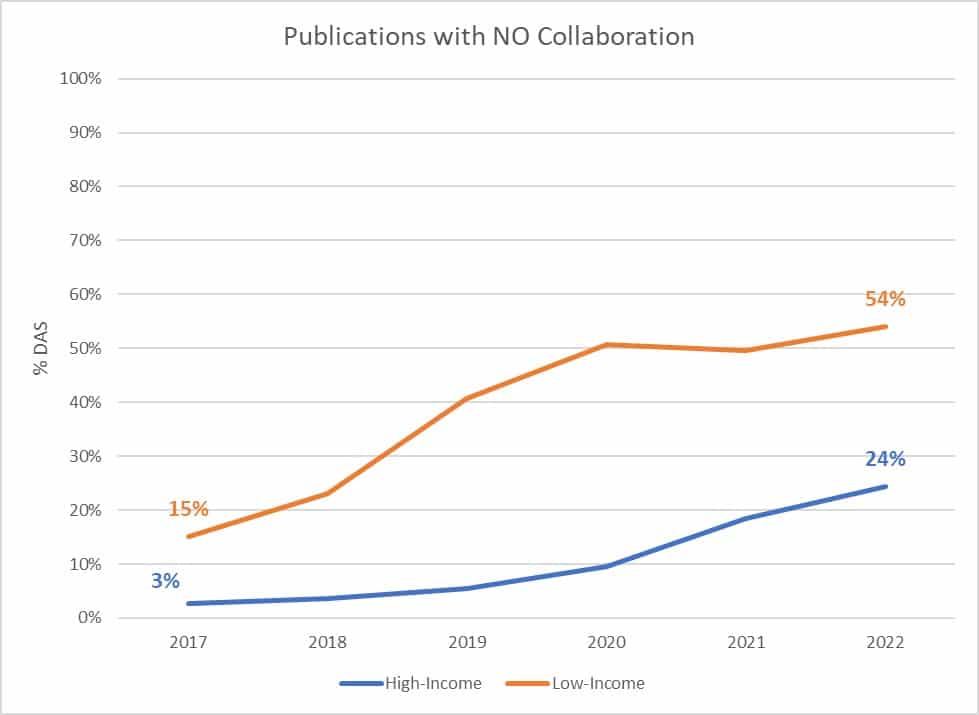
Figure 2 shows that the proportion of publications containing DAS with no outside collaboration increases from 3% in 2017 to 24% in 2022. When we look at those from low-income countries, the proportion of publications containing DAS increased from 15% in 2017 to 54% in 2022. The notable increase in the proportion of publications containing DAS for both high and low-income countries is indicative of a growing commitment to data transparency across both regions. The growth is more pronounced however within low-income countries. This could be driven by various factors such as the increased emphasis on open science practices or requirements set by funding bodies.
On examining similar data for publications that have national collaboration, i.e. those publications that have additional authors outside the institution but within the same country, we reveal some telling contrasts between research from high-income regions and low-income regions. Despite fewer national collaborations, Low-income countries have shown a substantial increase in publications with DAS, ranging from 28% in 2017 to 66% in 2022 (Figure 3). This marked increase indicates a robust movement towards open science, again possibly encouraged by funder requirements or international norms. high income countries, although displaying an increase in DAS prevalence, present a slower rate of adoption – with a noticeable increase only occurring after 2020. This suggests that while there is a general trend towards data sharing, mechanisms and incentives might differ from those in low-income countries.

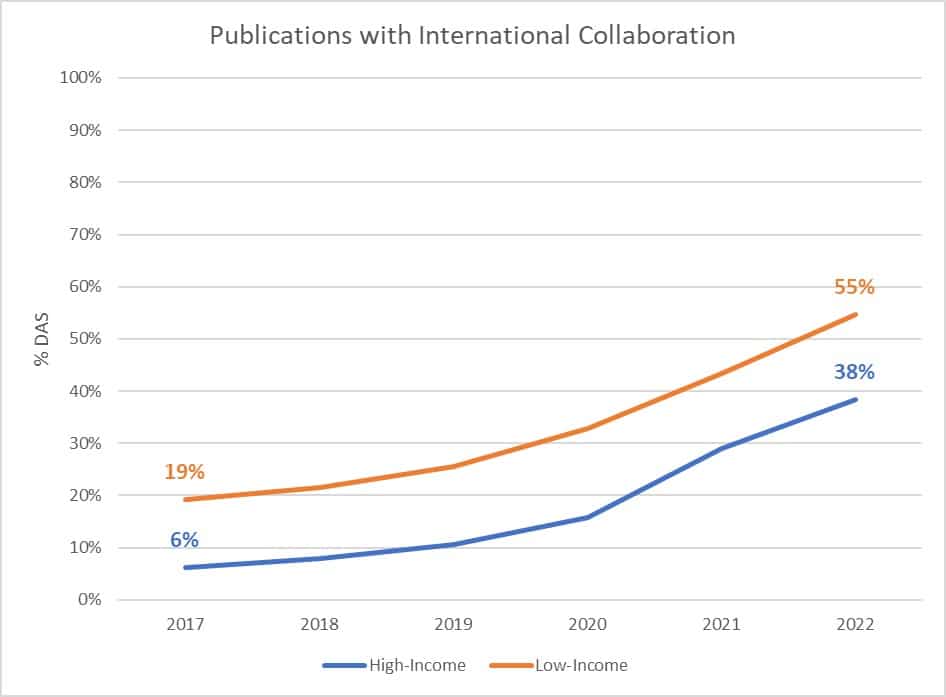
The increase in DAS in high-income countries (from 6% in 2017 to 38% in 2022) is consistent with national trends again reflecting a more gradual adoption of data sharing practices (Figure 4). In contrast, the growth in DAS for low-income countries (from 19% in 2017 to 55% in 2022) is notable, perhaps influenced by international standards and policies from collaborative bodies, which often require open data practices.
It is also important to note that, for the low-income country group, DAS practices are more frequently observed among publications with national collaboration (66%) than those with international collaboration (55%). Such a pattern does not exist for the high-income country group. But why? Are national research data sharing policies and regulation ascending the agenda? Does the type of research conducted in national collaboration entail stronger DAS practices?
With these questions, we zoom into Ethiopia as an example to explore the underlying funding and discipline focuses behind the country’s research output and whether they exhibit different DAS practices.
The Case of Ethiopia
Ethiopia has seen significant growth in research activity and outputs in recent years. At the same time, it has demonstrated rapid improvement in DAS practices.
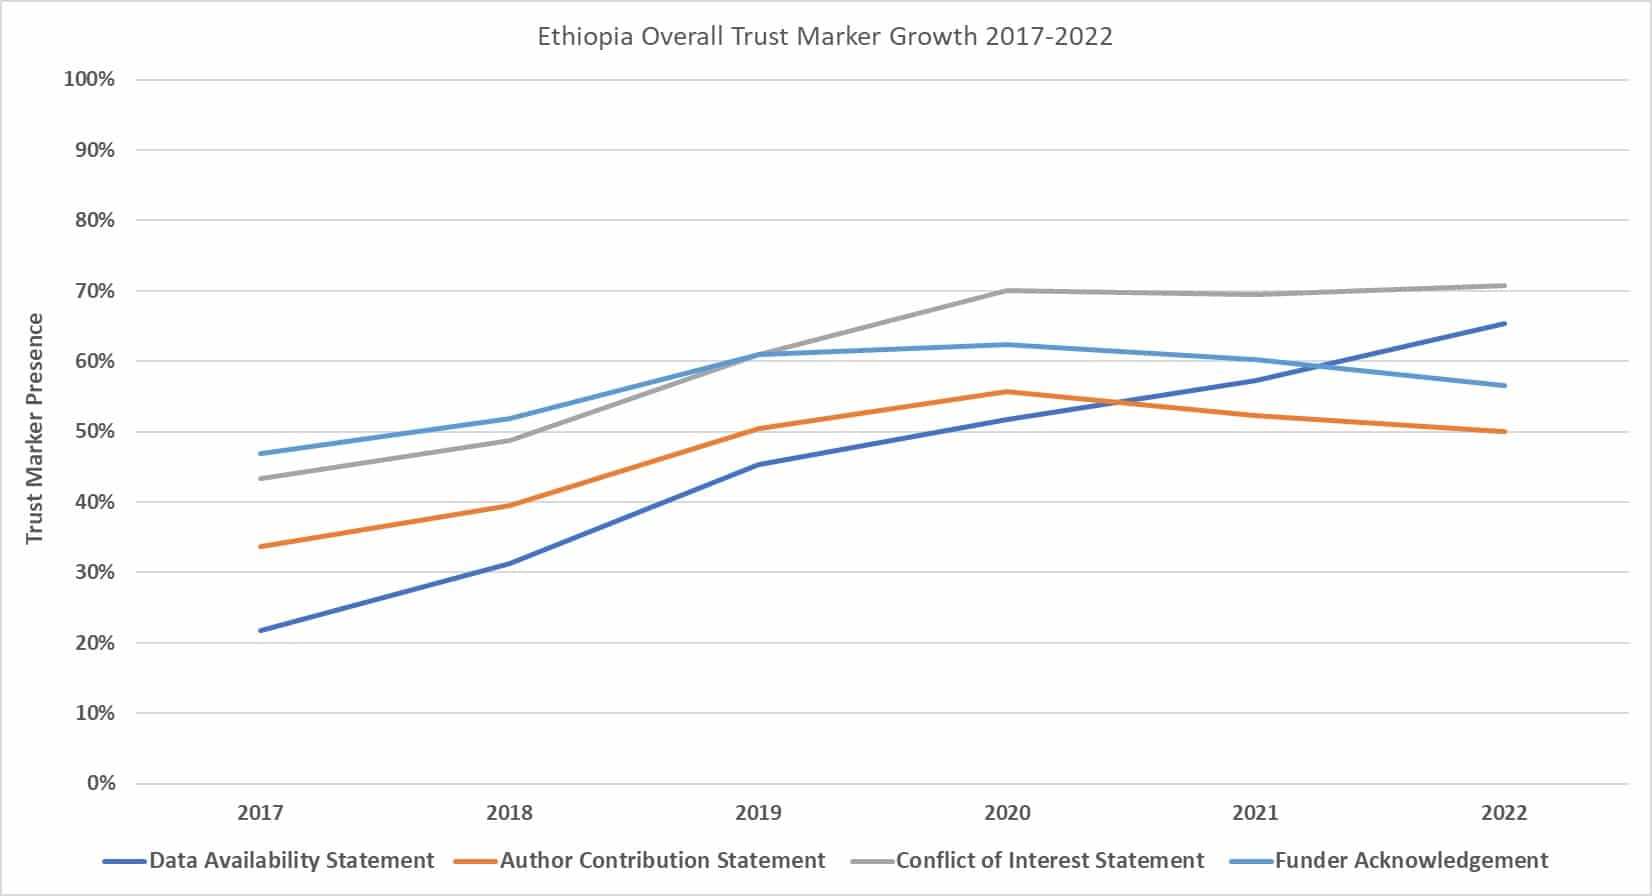
Figure 5 demonstrates how Ethiopia has emerged as the leading country in upholding research integrity within the lower-income group through the provision of DAS within its research output. Such practices not only distinguish Ethiopia in the context of lower-income nations but also demonstrate a level of best practice that out-competes with higher-income countries. This observation is complemented by Ethiopia’s stronghold in other Trust Markers (Figure 6).

Between 2017 and 2022, Ethiopia’s research output has increased more than three fold, from approximately 3000 publications to more than 11,000 publications (Figure 7). Concurrently, the % of publications with DAS increased from approximately 20% to 65%.

The overall growth in Ethiopia’s DAS practices coincides with its research focus in the area of Health (Habtewold et al, 2022). Between 2019-2022, of Ethiopia’s publications classified with an SDG, 61% are related to SDG3 Good Health and Well-being. This is substantially higher than the global distribution of SDG research, where 43% of publications with SDG classifications are related to SDG3 for the same period. This aligns with the general pattern we observed in Dimension’s research integrity database, where SDG3 stands out in terms of trust marker performance.
Having established that SDG3 dominates Ethiopia’s research landscape, a deeper dive into the data further reinforces the country’s research priorities. When categorizing publications by Field of Research (FoR), specifically output tagged as a national collaboration or a single institutional publication, it becomes evident that Biomedical and Clinical Sciences, together with Health Sciences, stand out as the predominant fields. These two Fields of Research represent 57% of Ethiopia’s independent research efforts throughout the same timeframe (Table 3). In contrast, when examining the FoR breakdown globally, the predominant areas of research are Biomedical and Clinical Sciences (23%) and Engineering (17%). This comparison further demonstrates the unique emphasis on health-related research within Ethiopia.
| Field of Research (FoR) | Total Publications Ethiopia (2019-2022) |
% Publications |
| 32 Biomedical and Clinical Sciences | 9239 | 32% |
| 42 Health Sciences | 7180 | 25% |
| 30 Agricultural, Veterinary and Food Sciences | 2469 | 8% |
| 40 Engineering | 1705 | 6% |
| 44 Human Society | 1649 | 6% |
| 31 Biological Sciences | 1333 | 5% |
| 41 Environmental Sciences | 1136 | 4% |
| 37 Earth Sciences | 841 | 3% |
| 46 Information and Computing Sciences | 524 | 2% |
| 35 Commerce, Management, Tourism and Services | 463 | 2% |
| 39 Education | 457 | 2% |
| 34 Chemical Sciences | 389 | 1% |
| 49 Mathematical Sciences | 351 | 1% |
| 38 Economics | 334 | 1% |
| 33 Built Environment and Design | 212 | 1% |
| 51 Physical Sciences | 211 | 1% |
| 48 Law and Legal Studies | 176 | 1% |
| 52 Psychology | 176 | 1% |
| 47 Language, Communication and Culture | 168 | 1% |
| 50 Philosophy and Religious Studies | 65 | 0% |
| 43 History, Heritage and Archaeology | 53 | 0% |
| 36 Creative Arts and Writing | 28 | 0% |
The subset of Ethiopian publications with national collaboration leads in DAS practices, followed by those with no cross-institution collaboration, and then publications with international collaboration. This suggests that a primary driver of change in DAS practices stemmed internally from Ethiopia as a country. One example is the country’s National Data Management Center for Health (NDMC), which serves as the hub to store, process, manage, and synthesize health-related research data for decision making by the Federal Ministry of Health. It is also important to consider the suggestion that Ethiopia’s research is primarily led by dedicated research institutes which maintain a national remit and are generally for the purpose of informing national policy.
In talking with Leslie McIntosh, VP Research Integrity, Digital Science, we have gained further insights. “Ethiopian researchers embody the spirit of open science that the country has wholeheartedly embraced”, says McIntosh. “When their government enacted open access mandates in 2019, requiring publicly-funded research to be freely shared, Ethiopia’s universities and libraries adapted quickly to comply. Now we see the fruits of that policy in action – with research data more clearly reported and made widely available to all. Ethiopia sets an example for putting open science policy into practice, building capacity and trust in its research through commitment to transparency and accessibility.”
Conclusion
An examination of DAS and other Trust Marker data in the Digital Science database suggests that research collaboration at various levels, nationally and internationally, encourages exemplary DAS practices. Significant improvements in research transparency, accessibility, and reproducibility are notable outcomes when individual researchers, institutions, and a nation work collaboratively to establish clear data management plans, guidelines, and sharing protocols. We note that while higher income countries demonstrate a steady improvement in DAS rates over time, the growth trajectory lags behind that of low-income regions. Income level alone does not fully determine integrity of research practices. Strategic policies, collaborative models and research agendas catering to local priorities and issues all play a part. We see the pivotal role of national agendas in facilitating DAS, as evidenced by the case of Ethiopia. A cohesive national strategy and commitment to data openness can significantly influence the success of research data management initiatives that benefit both the research community and society as a whole.
As the open science movement continues to gain momentum, tracking how these dynamics evolve across different regions will provide crucial insights into how a shared commitment to accessibility and best research practices can benefit scientific progress universally.
There is a keen anticipation for increased interaction with countries like Ethiopia and other African nations, acknowledging their crucial role in advancing the global progression of open science. As McIntosh noted, “I look forward to more interaction with Ethiopia and other African nations in the future to put open science policy into practice.”
References
[1] Aksnes, Dag W. and Sivertsen, Gunnar. “Global trends in international research collaboration, 1980-2021①” Journal of Data and Information Science, vol.8, no.2, 2023, pp.26-42. https://doi.org/10.2478/jdis-2023-0015
[2] Tesfa Dejenie Habtewold, Nigussie Tadesse Sharew, Aklilu Endalamaw, Henok Mulugeta, Getenet Dessie, Nigus G. Asefa, Getachew Mulu Kassa, Wubet Alebachew Bayih, Mulugeta Molla Birhanu, Balewgize Sileshi Tegegne, Andreas A. Teferra, Abera Kenay Tura, Sisay Mulugeta Alemu “Mapping publication outputs, collaboration networks, research hotspots, and most cited articles in systematic reviews and meta-analyses of medicine and health sciences in Ethiopia: analyses of 20 years of scientific data”. medRxiv 2022.02.24.22271416; doi: https://doi.org/10.1101/2022.02.24.22271416
[3] Assessing the needs of the research system in Ethiopia – GOV.UK
Further reading on using Dimensions data to explore research collaborations across income regions:
Porter, Simon J., and Daniel W. Hook. “Connecting Scientometrics: Dimensions as a route to broadening context for analyses.” Frontiers in Research Metrics and Analytics 7 (2022): 835139. https://doi.org/10.48550/arXiv.2112.08472


