Introduction
The Altmetric 500 is a new initiative that digs into the context of research output and the detailed measures of attention per source. We know Altmetric delivers insight into the wider impact and influence of academic articles, but how does this new initiative work behind the scenes?
New in 2024
This year, we decided to use Altmetric to investigate more closely global attention to research; we looked at articles and books with the most attention by geographic region and by a number of categories from news media, blogs, social media, policy documents, Wikipedia, and patents, as well as research that had broad attention across multiple mention source categories (the calculation is described below).
And, thanks to the recent release of Altmetric on Google’s BigQuery (GBQ), where this deep-dive report was put together, it can be rebuilt, tweaked or customized by anyone with a licence to the data. By introducing additional filters, a whole new set of insights has been created:
- publishers can use the data to understand how, where, and by whom their published content is being shared;
- funders can learn where their funds made the biggest splash;
- research institutions can focus on the research produced by themselves and similar institutions.
Because we believe strongly in data availability, we have shared the code we used on Figshare to be accessed, copied, and reused by others (for non-commercial purposes, of course).
It is our belief that there are no choices in the study of science that come without exclusion; the purpose here is not to provide a definitive list of the “best” papers published in 2023 (December 2022-November 2023). The list (like this post) shows that “attention” can mean many things, and what really matters is the question one is asking. We’d like to open the conversation, and look forward to seeing what the research community does with the data.
How we put this report together
Initially we broke publications down by field of research, using the ANZSRC 2020 Fields of Research (FoRs); the United Nations Sustainable Development Goals (SDGs); and exclusively regional collaboration. The results show in brilliant colour what we already knew to be true: the deeper you dig, the more remarkable science turns out to be!
Through the magic of machine learning, Dimensions categorizes research output, assigning Sustainable Development Goals (SDGs) and fields of research (FoRs) to the appropriate publications. (More information about how that magic works can be found here for SDGs, FoR identification, and the Dimensions Data Approach in general.)
Global regions (listed in Table 1) were assigned with the aim of democratising our attention to the research landscape: for the regional highlights, we limited our results to those papers produced in collaboration within these regions (excluding those where there was collaboration outside the region). This approach to geographic distribution is deliberate but open to discussion. It was important for us to display a more equitable distribution of publications and not have data from some regions be overshadowed by countries that have an extremely high number of research publication outputs. Therefore, for example, Mexico is grouped with Latin America and the Caribbean instead of North America, and Oceania excludes Australia and New Zealand.
| Table 1. Geographic Regions in the Tops of 2023 | ||
| Geographic Regions | Titles | Top Categories |
| multi-region | 75 | 134 |
| United States | 69 | 112 |
| European Union | 26 | 40 |
| United Kingdom | 17 | 22 |
| Sub-Saharan Africa | 10 | 19 |
| Latin America and the Caribbean | 10 | 16 |
| Eastern Asia | 13 | 15 |
| Northern America | 11 | 14 |
| Australia and New Zealand | 10 | 14 |
| China | 11 | 13 |
| Europe (non-EU) | 11 | 13 |
| Middle Asia | 10 | 12 |
| Northern Africa | 7 | 11 |
| Western Asia | 10 | 10 |
| Oceania (non-Australia/New Zealand) | 5 | 6 |
Methods
We defined our criteria for inclusion: publications that have been published between December 2022 and November 2023, with the type of chapter, article, or book. In calculating mentions and citations, we excluded any which occurred after December 1, 2023 (or were identified by Altmetric after June 25, 2024).
Attention
We counted the number of social media profiles (from Reddit, Facebook, X/Twitter) which had mentioned the publication (‘social_media_attention_sources’ in the breadth of attention calculation), the number of mentions in news or blog sources, and the number of citations in policy documents, patents, or Wikipedia pages.
Categories
For each publication, we used the Dimensions-assigned fields of research, any related UN Sustainable Development Goals, and the countries of the research organizations affiliated with each publication (a total of 555 categories, including the overall tops). Some publications were the top mentioned in more than one category or attention type (there are 362 unique articles in the Altmetric 500 of 2023).
Breadth of Attention
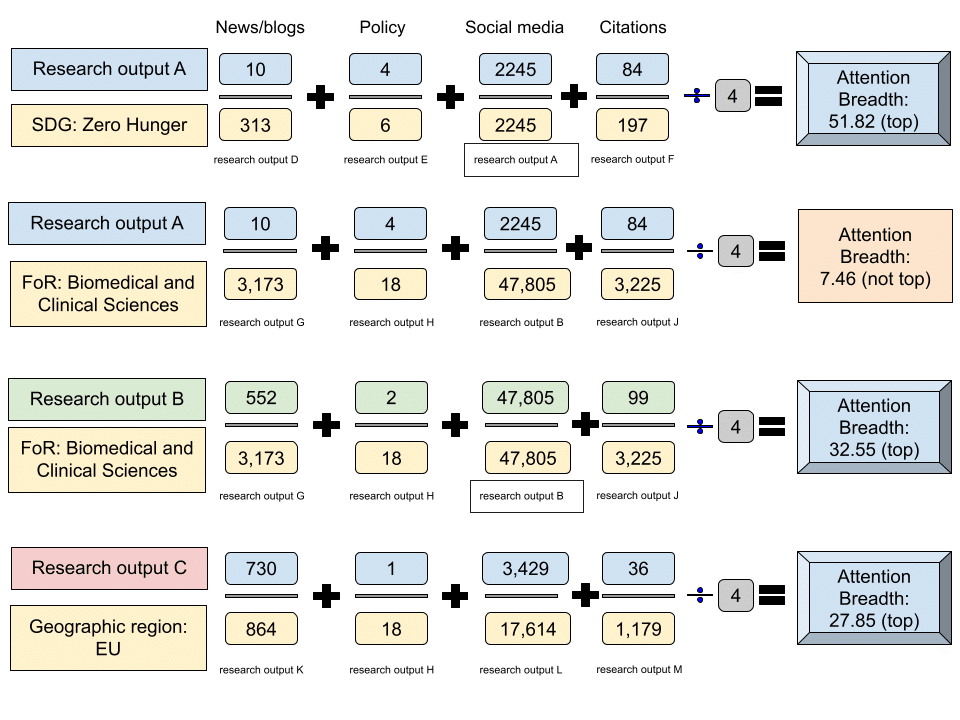
Figure 1 represents the calculation used to highlight breadth of attention. This calculation begins by identifying the highest number of social media attention sources, news/blog mentions, policy mentions, and scientific citations within each category (geographic region, research field, and SDG). The mentions received by each research output are then divided by the maximum number of mentions per category. These adjusted values are summed and averaged by four, to determine a “breadth of attention indicator” for each paper within each category. Each paper receives multiple breadth of attention indicators as it is evaluated across three different parameters: geographic region, research field, and SDGs.

Some Initial Observations
An interesting feature of the attention to research is that specific research output often gains attention in one attention source category while barely acknowledged in another. This holds true for the Altmetric 500 in general, and was notable especially in comparing the most-mentioned research output by Wikipedia pages versus news mentions (Figure 3). It was also interesting to note that the publications with the most attention in these venues were not necessarily those with relatively high scientific citation.
However, despite the tendency to excel in one category of attention rather than many, we would like to highlight the publications which garnered the most attention from multiple sources: in policy documents and scientific citation (Figure 2); in policy documents and news articles (Figure 3); on Wikipedia and in the news (Figure 4); or in the mainstream and social media (Figure 5). Hover over the scatter points on these images to see the titles which were most mentioned in these attention categories.
Policy vs. scientific citations
Figures 2 and 3.
Some examples we would like to highlight include:
1) One book in a series of three (Climate Change 2021 – The Physical Science Basis, Climate Change 2022 – Mitigation of Climate Change, and Climate Change 2022 – Impacts, Adaptation and Vulnerability), each of which made the Altmetric 500 for 2023, in multiple categories (with the most mentions in policy documents, on Wikipedia, and in scientific citations, in both the fields of Environmental Sciences and Economics, and the UN SDG Climate Action.
2) Introducing ACLED: An Armed Conflict Location and Event Dataset was the top of scientific citations and policy attention for publications produced within a single geographic region (in this case, the University of Oslo, in non-EU Europe), SDG 16 – Peace, Justice and Strong Institutions, and the field of Human Society.
3) Finally, COVID-19 pandemic and mitigation strategies: implications for maternal and child health and nutrition was the top for both scientific and policy citations in the UN SDG 1 – No Poverty and 6 – Clean Water and Sanitation, as well as top in scientific citations for the SDG 2 – Zero Hunger.
There are also articles which have had a relatively high level of attention from the scientific community (indicated by citations) and also received attention in policy documents (one of which has been mentioned in a patent application), but were not picked up by news media, blogs, or in social media. An example of this phenomenon is Atoms in molecules : a quantum theory.
| Table 2. Citations relative to policy mentions in Tops of 2023 | |||
| Title | Policy mentions | Dimensions citations | Top categories |
| 1a) Climate Change 2021 – The Physical Science Basis | 57 | 2061 | 4 |
| 1b) Climate Change 2022 – Mitigation of Climate Change | 41 | 475 | 3 |
| 1c) Climate Change 2022 – Impacts, Adaptation and Vulnerability | 60 | 2108 | 2 |
| 2) Introducing ACLED: An Armed Conflict Location and Event Dataset | 73 | 1102 | 6 |
| 3) Screening, Brief Intervention, and Referral to Treatment (SBIRT) | 18 | 811 | 3 |
The scatter plot of news and blog mentions relative to policy document mentions shows that most attention to the tops are either highly cited by news/blogs or policy, but the few papers which were the most highly cited in both highlight some of the major issues of 2023: GPT/LLMs and long Covid, as well as areas of perennial attention (climate change and autism). The publication Introducing ACLED had the highest number of policy mentions (in 60 policy documents from policy organizations including the World Bank, the Food and Agriculture Organization of the United Nations, Africa Portal, and the National Bureau of Economic Research), but did not have any news attention at all.
News vs. Wikipedia and News vs. X attention
Figures 4 and 5.
Finally, the European Commission (EC) had the greatest number of titles and top categories among funders; these numbers rise substantially when European Research Council (ERC) grants are also included. The titles associated with these grants are listed in Table 4. These titles are often in the top of one or more SDGs and one or more fields; they top news and blog mentions, have exceptionally broad attention and include tops of Wikipedia, X profiles, and Facebook walls.
We cannot explain here why publications gather more attention in one source than another, but Altmetric exists to provide the kind of data about attention that could be used to investigate that question.
Next Steps
Over the next few months, we’ll be exploring many facets of this dataset. The wide range of sources of attention make this an interesting dataset, no matter what kind of attention is interesting to you. Connecting the results to Altmetric on GBQ makes the results sortable and aggregatable by publisher, journal, funder, and affiliated university (see them listed below).
Tables 4-8.
We’ll also be comparing this method to the approach of the previous Top 100 lists. To set the stage for that analysis, keep your eyes peeled for Ten Years of the Top 100, coming soon.
A note of caution
Among the Altmetric 500 are a few articles which may have attracted attention for unexpected reasons. At Digital Science, we think all research should be visible and that includes research published in non-indexed and emerging journals, or on preprint repositories. It also means that we don’t remove retracted papers from our dataset. We highlight them, include retraction notices in our publications dataset, and follow the publisher’s title edits to indicate retractions. It should come as no surprise to followers of recent news that retracted articles also garner a lot of attention. We track that, too. We think this information is worth having, and worth studying (see our own Leslie McIntosh’s posts on the misuse of research in law and identifying plagiarism. Which retracted articles get attention tells us a lot about what matters in public discourse, and the fact of article retraction tells us a lot about the challenges that confront science in our digital publishing world and in a culture of “publish or perish”.
For example, Nature’s RETRACTED ARTICLE: Evidence of near-ambient superconductivity in a N-doped lutetium hydride is in this year’s Tops, having been discussed by the most news/blogs, the most YouTube videos, and having the greatest breadth of attention in the field of chemical sciences. There was a big buzz about the results of the paper when it was published, because the world is waiting for better solutions for conductivity. The Dimensions Research Assistant tells us that, “Near-ambient superconductivity matters because it brings the prospect of superconducting technologies operating at practical temperatures and pressures closer to reality, potentially transforming energy transmission, storage, and magnetic applications with unprecedented efficiency and reduced environmental impact (Mourachkine, 2006).” There was a second burst of attention following the retraction note published in November 2023 (which also gained substantial attention).
Data Sources
The Altmetric 500 can be found in Figshare: https://doi.org/10.6084/m9.figshare.25047692
More about Altmetric on GBQ can be found here: https://www.altmetric.com/solutions/altmetric-on-gbq/


