Subscribe to our newsletter
From subversive to the new normal: 25 years of Open Access
As part of Open Access Week, Simon Linacre looks at 25 years of Open Access through the lens of Dimensions to help us better understand the growth of OA over a quarter of a century.
How old is Open Access? In some ways it is as old as research itself, as at least some results have always been shared publicly. However, since the first journals were published in 1665, accessibility has been an issue, with distribution of paper journals limiting potential readership. When the internet came along, it lowered the barriers to access considerably and opened up the pathway towards Open Access. But that process has been a gradual one.
As a tutor for ALPSP and course leader for some of its industry training modules, I have to be wary of approaching topics such as Open Access. Not because it is especially contentious or difficult, but because as someone who has been involved in scholarly communications for over 20 years, it still feels relatively ‘new’ to me, whereas for most attendees it is simply part of the modern furniture of publishing.
However, as Churchill once said, the longer you can look back, the farther you can look forward, so this year’s OA Week seems as good a time as any to review how its development has progressed over the years. Luckily, in Dimensions we have a tool which can look at millions of articles, both OA and closed access, published over the last quarter of a century.

Back story
Pointing to a specific time to say ‘this is when OA started’ is difficult, as experiments with OA publishing arrived with the internet in the late 1980s and early 1990s. Perhaps the first rallying cry in support of OA came in 1994 when Stevan Harnad published his Subversive Proposal. However, in 1998 several things happened which started to shape the way OA would develop, including the setting up of a number of support networks for authors to advise how to follow the OA path, as well as the founding of the Public Knowledge Project (PKP). New tools and services introduced then started to re-engineer how academic publishing operated, which were only amplified by the global adoption of the internet.
Such developments were followed in subsequent years by major declarations from academics and institutions in support of OA, mainly from European cities starting with ‘B’ – both Budapest and Berlin were the basis for such declarations that propelled Open Access forward and firmly onto the agendas of all stakeholders. Some countries and academic cultures adopted OA principles quickly such as Brazil, however it wasn’t until the 2010s that we started to see significant policy changes in Global North countries such as the US and the UK.
These OA policies have now not only become commonplace, but have strengthened with initiatives like Plan_S in Europe and the OSTP (or Nelson) Memo in the US driving forward the transition towards fuller OA. It feels like the rate of change has increased in the last few years, but is this true and what does the picture look like globally?
Ch-ch-ch-changes
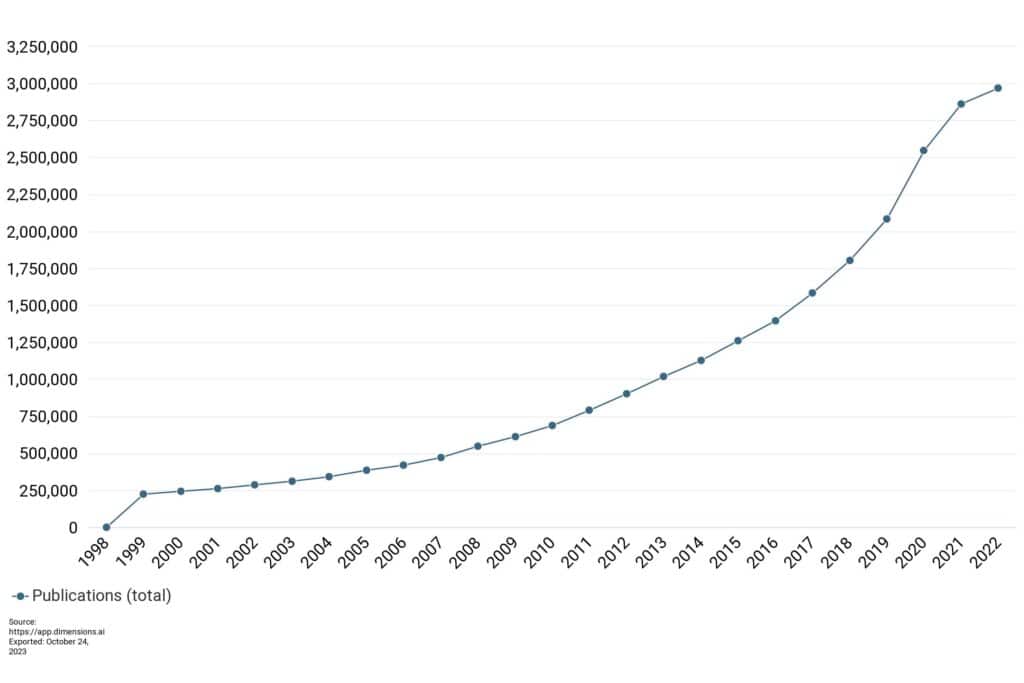
As we can see in the chart below using Dimensions, growth in OA research article publications has been relatively steady over the last 25 years, with a steeper rise in recent years followed by a shallower rise in 2022. This can perhaps be attributed in part to the introduction of Plan_S in 2018 and the introduction of funder mandates, but also the impact of the Covid-19 epidemic which drove OA publications upwards in 2020 and 2021, not least through the avenue of OA preprints.

However, appearances can be deceptive. While the chart may seem to plot a steady increase, the 12-fold rise over 25 years is significantly faster than the four-fold rise seen from all research articles, with all OA articles now making up well over half of all articles.
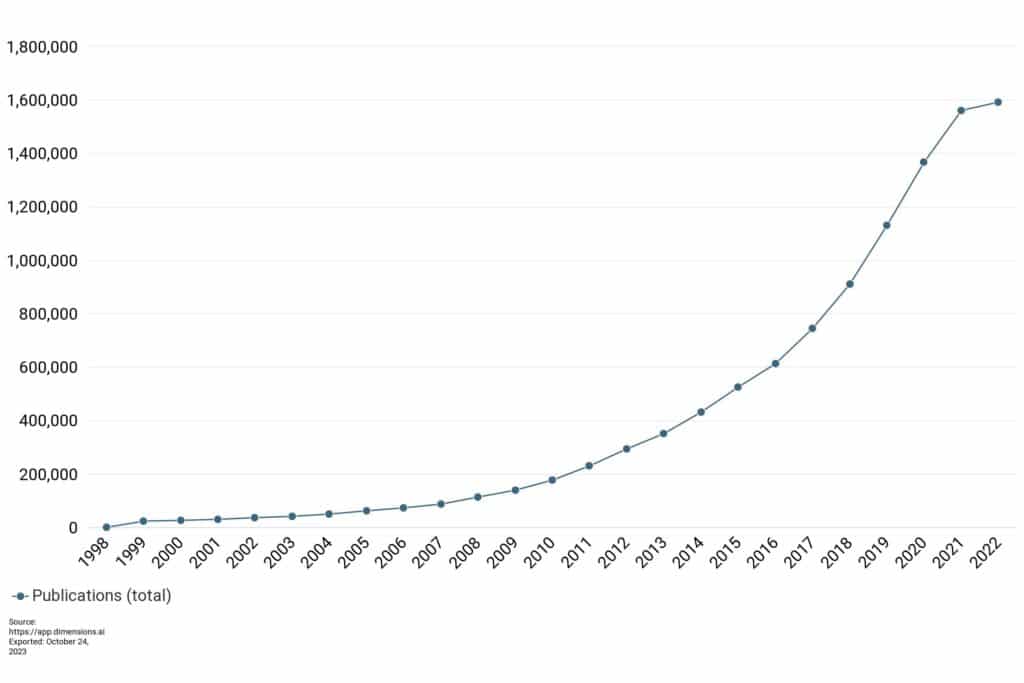
Looking more closely at the type of OA article recorded on Dimensions, if we look just at Gold OA research articles over time (ie. those published in journals, typically after payment of an article processing charge (APC)), we see a similar development, albeit with a slower take off and steeper rise in recent times.

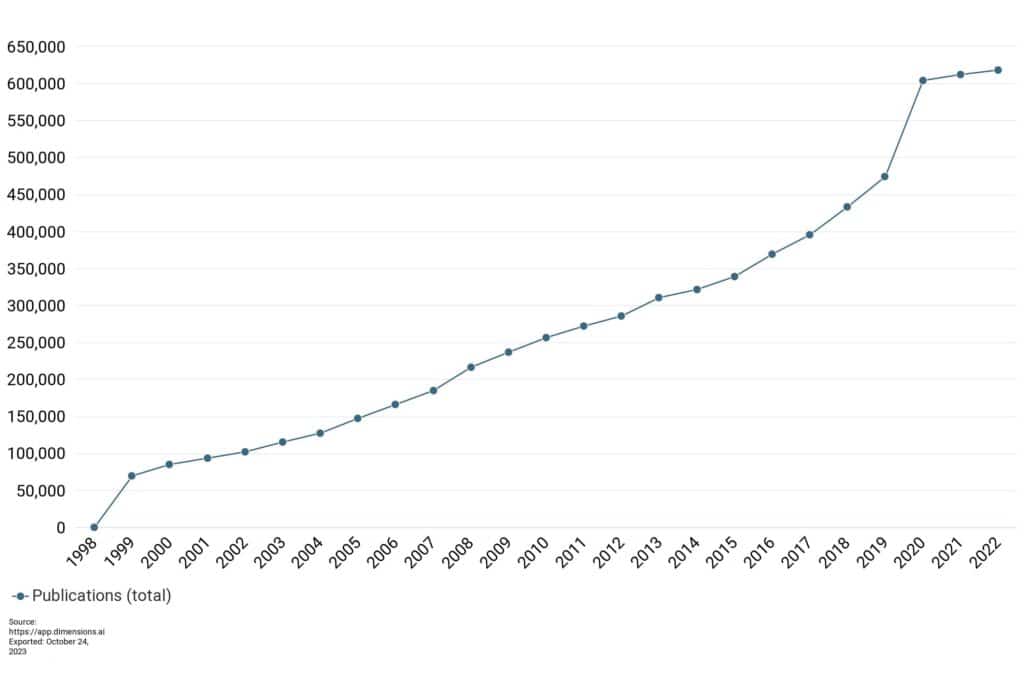
However, if we look at Green OA research articles made available over the same period, we see a much more complex development, with higher rates of adoption in the early years of OA following a shallower trajectory before a huge spike in 2020, driven by the aforementioned pandemic.

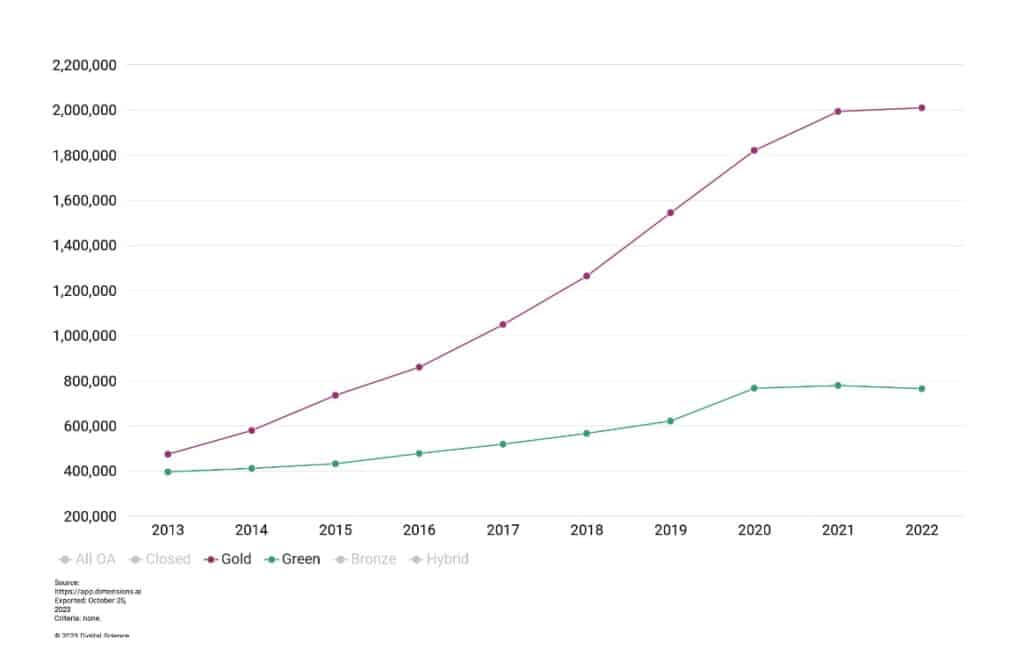
We can see the change more markedly below if we look at all publications (as opposed to just research articles) in more recent years, with Green and Gold running neck-and-neck until they diverged over the last decade or so. For many early proponents of Green Open Access who were opposed to the high profit margins enjoyed by many, this highlights how Green OA has failed in comparison to Gold Open Access.

Looking ahead
What do these data tell us about the next 25 years? Perhaps the key takeaway is that shifts in behaviour of authors can be caused by concerted policymaking. Indeed, even the commitment to future mandates can be a catalyst for change as publishers prepare the groundwork quickly for upcoming changes. However, the biggest single shift towards OA happened during something wholly unforeseen (the pandemic), and as geopolitics is in its most volatile state in the whole 25 year period, maybe the biggest changes in OA are just round the corner.
Request a demo or quote

About the Author
Simon Linacre, Head of Content, Brand & Press | Digital Science
Simon has 20 years’ experience in scholarly communications. He has lectured and published on the topics of bibliometrics, publication ethics and research impact, and has recently authored a book on predatory publishing. Simon is also a COPE Trustee and ALPSP tutor, and holds Masters degrees in Philosophy and International Business.
